Have you ever wanted to dig deeper for explanations as to why your applications are bulking up on memory or the CPU spikes up? While monitoring tools tell that it is happening, you don’t know why.
This is when profiling is fantastic. Profiling offers better insight into how your application interacts with CPU or memory. It allows for easier access for making optimizations to how your code behaves.
Go comes with a native profiling tool called pprof. It offers a wide range of components it can profile such as memory allocation (current and past), CPU, stack traces for goroutines, and various other options.
Basic Setup
Getting started with pprof is fairly straight forward. At the most basic example, it requires you to import net/http/pprof as a blank identifier. This triggers an init function that will configure the pprof endpoints. Note we are use the HTTP handler from net/http depending on which HTTP handler you are using, the way you configure pprof may vary.
package main

import (
        "log"
        "net/http"
        _ "net/http/pprof"
)

func main() {
        log.Println("booting on localhost:8080")
        log.Fatal(http.ListenAndServe(":8080", nil))
}
With this basic setup, while running, pprof will expose endpoints which you can interact with to start gathering profiles on your applications.
Pprof endpoints
So what does pprof expose and offer to us for profiling and how do I access it?
The pprof endpoint can be reached at http://localhost:8080/debug/pprof as for what endpoints are available, here is a list with a short description of each.
/debug/pprof/allocs: A sampling of all past memory allocations
/debug/pprof/block: Stack traces that led to blocking on synchronization primitives
/debug/pprof/cmdline: The command line invocation of the current program
/debug/pprof/goroutine: Stack traces of all current goroutines
/debug/pprof/heap: A sampling of memory allocations of live objects. You can specify the gc GET parameter to run GC before taking the heap sample.
/debug/pprof/mutex: Stack traces of holders of contended mutexes
/debug/pprof/profile: CPU profile. You can specify the duration in the seconds GET parameter. After you get the profile file, use the go tool pprof command to investigate the profile.
/debug/pprof/threadcreate: Stack traces that led to the creation of new OS threads
/debug/pprof/trace: A trace of execution of the current program. You can specify the duration in the seconds GET parameter. After you get the trace file, use the go tool trace command to investigate the trace.
Interacting with pprof
To interact with pprof we can use the following command go tool pprof. There are two ways to use this command. The first using it on the CLI or the second way to visualize it with a web interface. Do know that pprof will present data that it had captured over a set period of time. The default for the commands below is 30 seconds. You can adjust this by appending ?seconds= to your query and this will tell pprof how long to profile before presenting results.
Here is a breakdown of what the command would look like
go tool pprof http://localhost:{APP PORT}/{pprof endpoint}
The app port would be the port that pprof is running on. In our case it would be 8080. As for pprof endpoint, this any of the endpoints listed above that you wish to profile.
A full example for command line interaction would be :
go tool pprof -http://localhost:8080/debug/pprof/heap
While a full example for web interaction would be as follows with a slight addition of a http flag:
go tool pprof --http=:8081 http://localhost:8080/debug/pprof/heap
Note: that the port provided here can be anything you like, as long as the port is not in use.
If were to run the following command go tool pprof --http=:8081 http://localhost:8080/debug/heap/ pprof will profile our application memory for 30 seconds. It will then open up a webpage that look like similar to this.
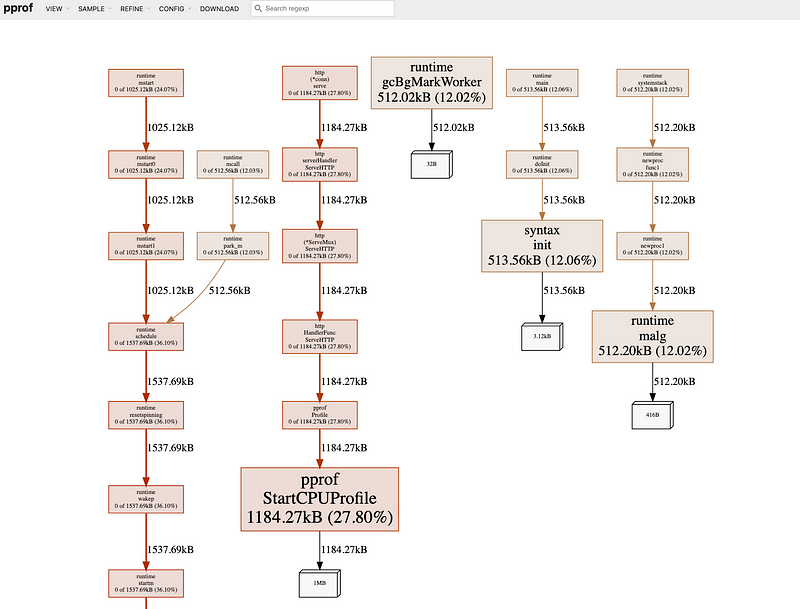
Here we have a breakdown of our application’s memory usage. The larger the box will always correspond to it’s usage, whether this is CPU, memory, etc, so in this example we see that StartCPUProfile is the biggest consumption of memory with 1185.27kB
Final Thought
While using tools such as Prometheus and Grafana are great (and necessary) to monitor and keep a pulse on your applications. Pprof extends itself in addressing any strange spikes in your go applications that might pop up on your monitoring.
Hopefully, this post can shed some light on how powerful a tool like pprof can be in fine-tuning or debugging pesky problems in your Go applications.